
library(ggplot2)vec <- rnorm(n = 10000)
ggplot(as.data.frame(vec)) + aes(x=vec) +
geom_histogram() + theme_minimal()`stat_bin()` using `bins = 30`. Pick better value with `binwidth`.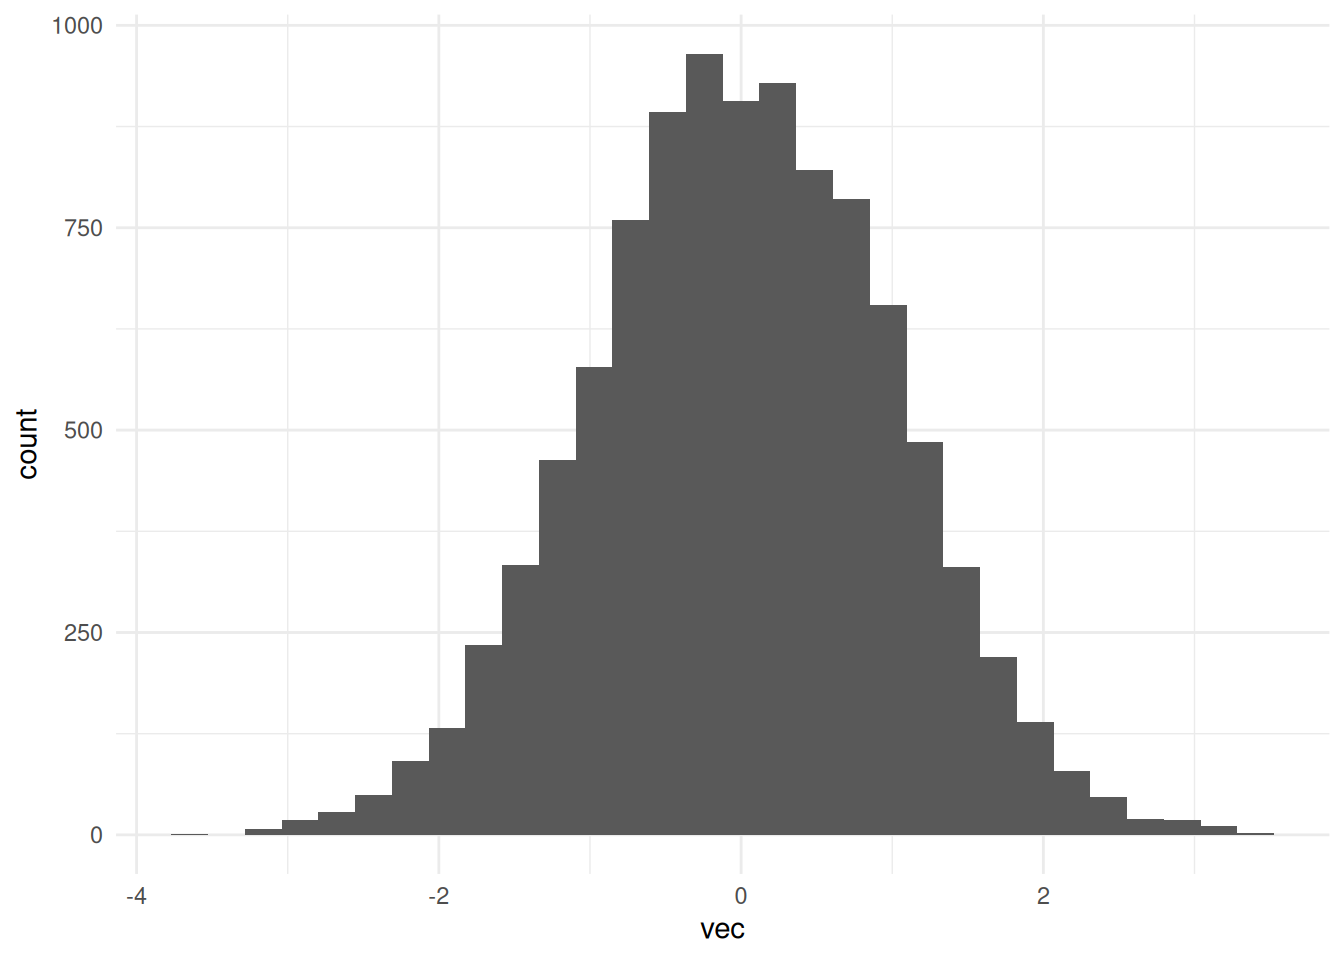
library(ggplot2)vec <- rnorm(n = 10000)
ggplot(as.data.frame(vec)) + aes(x=vec) +
geom_histogram() + theme_minimal()`stat_bin()` using `bins = 30`. Pick better value with `binwidth`.